The Complete Guide to Management Reporting in 2022 [+ Free Template]
Kenneth Weesgaard
Table of contents
- What is management reporting?
- Why is management reporting important?
- What are some of the challenges of management reporting?
- What are the different types of management reporting?
- What’s the difference between management reporting and financial reporting?
- The Six Steps to Creating a Management Report
- Management Report Example for a Professional Services Company
- How to improve your management reports in a Professional Services business
- Conclusion
In this guide, we’ll cover everything you need to know about management reporting.
We’ll explain why you should be using it, how to create a successful report, and we’ll even provide you with the six steps to creating a management report.
By the end of this post, you’ll be able to create an accurate and insightful management report with ease.
As an added bonus, we’ll share a free management report example that includes a list of the KPIs every Professional Services company should be using.
First thing’s first though, let’s answer the most obvious question: what is management reporting?
What is management reporting?
Already know the basics? Skip ahead to the six steps for management reporting.
Management reporting serves to provide the management team within an organization with the data and information they need to make more informed decisions.
In this way, C-Level executives and managers can work with their teams to enhance and improve the performance of a business.
Management reporting aggregates data on a broad range of KPIs from a number of different departments within an organization, and consolidates it into an easily comprehensible format.

In order to do this effectively, businesses require multiple data sources and some form of dashboard or management reporting system.
Most data-driven businesses these days have access to an extremely wide range of information, which is just one reason that management reporting can be a difficult task - particularly if you’ve never done it before.
Management Reporting Definition
We can therefore use the following definition:
“Management reporting is a method of presenting business intelligence findings. It gives leadership teams precise information about where they are succeeding and failing, which allows them to develop strategies to improve the profitability of a business.”
Why is management reporting important?
Management reporting is so crucial because it allows C-Level managers to definitively answer questions that in the past would have been based predominantly on estimates or inaccurate figures.
And research bears this out.
According to one survey, the majority of organizations agree that business intelligence and management reporting resulted in better business decisions, improved employee satisfaction, and enhanced customer satisfaction.

Some of the questions that management reporting can answer include:
- Am I charging enough for my work?
- Once all of my expenses are considered, am I actually making a loss on certain clients, jobs, or products?
- Which of my clients are the most valuable, in real terms?
- Do I need more staff in certain areas, and if so how much can I pay them and remain profitable?
- Am I paying my current staff too much or too little?
- Am I spending enough, too little, or too much on marketing and sales?
- Is my internal supply chain efficient enough?
As you can see, management reporting covers a wide range of topics within a business.
How does management reporting work in practice?
Let’s take a closer look at one of the questions above: Once all of my expenses are considered, am I actually making a loss on certain clients?
Let’s say that you’re the CEO of a small advertising agency. You bill one of your high-value clients the bargain price of $1000 a month.
However, using a management reporting system along with project management and accounting software, you discover that one of your employees spends 80 hours a month on average on this high value client.
This is through a combination of actual work, internal and external meetings, research, phone calls, and answering emails.
You pay that staff member $2000 per month, and about half of their time each month is spent on that one client.

Professional service businesses sell their employee’s time at the best possible rate.
In real terms, this means that you’re barely breaking even on your “high-value” client.
And that doesn’t even account for any other fixed costs your business has, like rent.
The same employee also works with a client who you consider less valuable, who you charge $750 per month.
However, the second client only takes up 10 hours per month of your employee’s time.
Using your management reporting system, you’re able to conclude that the client who pays less is actually more valuable to your business from a financial perspective.
While this isn’t necessarily grounds to cut ties with the “high value” client, it does give you crucial insights.
Now, you can start to formulate a strategy for how to improve the situation based on the findings of your management reporting.
Maybe you should charge the client more, or work out a way to reduce the amount of time your employee is spending answering their emails.
Or perhaps you’re willing to absorb the cost because the client is likely to sign a much larger contract in the future.
This management report example is obviously an extremely simplistic scenario.
But it’s easy to see how it becomes vastly more complicated once you account for the wide range of costs, employees, clients, and other variables in a larger business.
This is where project management reporting comes into play.

Using a free dashboard or management reporting system like GoSimplo to integrate your different data sources, you’re able to visualize this important information quickly and easily.
As a result, you are spending less time searching through your data, and more time implementing solutions to the problem of the client who’s taking up all your staff member’s time.
The History of Management Reporting
In the above example, our hypothetical advertising business was only able to make its discovery about its biggest client because of the data visualization tools and management reporting it had available.
You could reasonably argue that the project management reporting system has been around since the dawn of business in the form of ledgers and notes.
However, management reporting in its current form traces its history back to the beginning of computing in the 60s. As you would expect from that time period, even the most basic reporting required room-sized computers and entire teams of people.
As computing has evolved, so too have the systems. In the present day, a plethora of insights are accessible for a single person with a laptop.
This represents a pivotal moment within the sector, as dashboards and management reporting system around business intelligence allow those without advanced IT or data science skills to draw insights.
What are some of the challenges of management reporting?
One of the biggest challenges of management reporting is putting together the actual report itself.
This is partly due to the dizzying variety of data sources and KPIs available to businesses today, something which will only get worse as the use of big data increases.
In some ways, it could be argued that having too much performance and financial data without the ability to analyze it effectively is nearly as problematic as having no data to begin with.

This is borne out by a Deloitte report from 2016, in which it was revealed that managers only spend 24% of their time analyzing and acting upon the conclusions of their management reporting.
Conversely, they spent 59% of their time putting together ad-hoc and standard reports.
Likewise, 72% of respondents stated that they felt that reporting processes were the biggest area that could be improved.
As implementation is the end goal of project management reporting, this research suggests that managers without effective reporting solutions are potentially veering from one report to the next, without the capacity to fully implement the conclusions of their hard work.
The importance of a data visualization tool such as a dashboard or a management reporting system can’t be understated when compiling reports.
What are the different types of management reporting?
Management reporting can have a wide range of functions, based on the department the reports originate from or the question they are attempting to answer.
That said, here are a few of the different categories of management reporting.

Scheduled Management Reports
Scheduled reports occur on a regular basis, every week or every month. They contain the same information in each report, and are the most common form of management reporting.
Scheduled reports include project management reporting, which tends to focus on a more specific department.
On-Demand Management Reports
On-demand reports are produced in response to a specific event or occurrence, and are usually more specific than scheduled reports.
For example, if customer satisfaction has dramatically dropped, then an on-demand management report may be ordered to determine the cause.
Predictive Management Reports
Predictive reports are a particularly exciting aspect of business intelligence and management reporting, allowing businesses to use data to predict future trends.
A predictive management report is often used to determine the future profitability of an organization, and can heavily influence decision-making.
Regulatory & Required Management Reports
Regulatory reporting is the financial reporting that is required by law in different countries. Reporting in management accounting would fall into this category.
End of year accounts and profit/loss statements for tax purposes are considered to be regulatory management reporting.
This type of reporting is beneficial in providing an overview, but often lacks the granular detail required for decision-making.
What’s the difference between management reporting and financial reporting?
One question that regularly pops up in this space is what the difference is between management reporting and reporting in management accounting.
This confusion is completely understandable, as many management reports include detailed financial information.
In layman’s terms though, there’s two fundamental differences between reporting in management accounting and regular management reporting.
Firstly, financial or accounting reporting usually falls into the “regulatory & required reports” category that we mentioned above.
This means that reporting in management accounting is normally carried out because it is required by law. It includes information like profit, loss, and revenue in order to calculate tax information.

The second big difference between financial reporting and other forms of management reporting is that financial reports lack the context to provide actionable information.
For example, a year-end financial report for a firm of consulting engineers may well reveal that the business has made a loss.
But the report won’t reveal that this loss was caused by a decrease in staff productivity due to a large client requiring a greater time-commitment that was not billed, which in turn led to the loss of a different client.
A management report would be extremely effective in this situation, as it would allow our fictitious business of consulting engineers to forward plan: they would be able to adjust their practices for the future based on this information.
This is arguably the most important difference between reporting in management accounting and management reporting - the latter provides insight and ‘the why’, whereas financial reporting simply portrays a static overview of a business.
The Six Steps to Creating a Management Report
Now that we’ve answered the question: What is management reporting? and covered why you should be doing it, let’s take a look at the steps to creating a management report.

Step One: Collate your data sources
First thing’s first, you need to know what metrics and data you have access to. There’s little point in planning an extensive management report only to discover you’re unable to extract the information you need.
Take a quick look through your business intelligence, financial, accounting, and project management software and make a note of any metrics you think could be relevant.
In the next section, we’ll cover some of the specific metrics a professional services company should use in our management report example.
Step Two: Define your audience
It goes without saying that you should define the audience for your management reporting system before you start creating it.

Different departments and industries care about wildly different metrics, and the management report you would prepare in one circumstance will not apply to another.
Step Three: Confirm which metrics you’re going to use
If you collated your data sources earlier, you should already have a pretty good idea of which metrics you’d like to use when finalizing your management reporting. This is the stage where you might want to brainstorm different ideas that could give a new slant on things.
One thing to consider is that you’re trying to create a narrative. There’s no point in bombarding your audience with dozens of different metrics that aren’t relevant.
Instead, you should be looking at the data you have to find out what information is being revealed.
If a particular metric doesn’t offer additional insight or value, don’t include it: the best management report tells a story.
This step can be overwhelming if you have access to a wide range of data. If you’re struggling, go back to the type of management report you’re trying to create - what is the purpose? What are you trying to show?
This should help you to pinpoint the metrics you need.
Step Four: Use a dashboard or data visualization tool
There are many free dashboard tools out there that allow you to visualize your key data, or even combine metrics to create that one KPI that you’re after.
Don’t spend hours working between different platforms and endless spreadsheets - it’s a waste of your time and there are simpler solutions.

Take GoSimplo for example. It’s a zero cost dashboard designed for professional services businesses. You can integrate with your project management and financial software to create a holistic overview of all the key metrics you need for management reporting.
In short, avoid starting from scratch and use the tools that are out there!
Step Five: Create your report
Once you’ve decided what your data is telling you, you can start to build your report. How detailed it is depends on the audience and purpose of the report, but comprehensibility is crucial.
Everyone has been in a meeting or read a document at some point in their lives that consists of pages upon pages of text and figures.
Let’s be honest...it’s incredibly boring.
If you want to keep your audience engaged, try to create a dynamic and well-spaced report that doesn’t bombard people with excessive information or terminology.
Essentially, keep it as simple as you can!
Step Six: Implement the conclusions of your report
Finally, you should devise strategies that fix any issues your report has thrown up - this is the most important step!
It’s also important to remember that it’s much easier to conduct management reporting if your entire team is on board with the process.
If you don’t have accurate data to work with, you can’t create a great report - and this mentality should permeate the entirety of your business.
You need to make the benefits of using data clear to your team - both from the perspective of the business, and from the perspective of individuals.
Management Report Example for a Professional Services Company
Like every sector, achieving profitability with a professional services company can be boiled down to a fairly straightforward goal.
You have a pool of staff hours that you are attempting to sell to your clients in the most efficient, effective, and profitable way.
While there are, of course, a myriad of different ways to achieve this and hundreds of different factors to consider within the day-to-day running of a professional services company, this overall goal underpins everything.
The Metrics Every Professional Services Company Should be Using
As a result, there’s a few KPIs that provide crucial insight when drafting a management report for this type of business, which we’ll cover in this management report example.
Time Entry %

While this metric does not necessarily indicate much about your performance, it’s a basic requirement for all other metrics to work.
In a nutshell, your Time Entry % indicates what percentage of their time your employees are entering into your project management reporting software.
For example, if one of your employees works for 40 hours each week, but has only logged 30 of those hours in your project management software, their time entry percentage would be 75%.
Ultimately, you can’t measure your performance on an ongoing basis if your team is not attributing their time to different projects and clients, and this is critical in management reporting.
While it’s unrealistic to expect 100% figures across the board, this percentage should be as high as possible.
Billable Time %
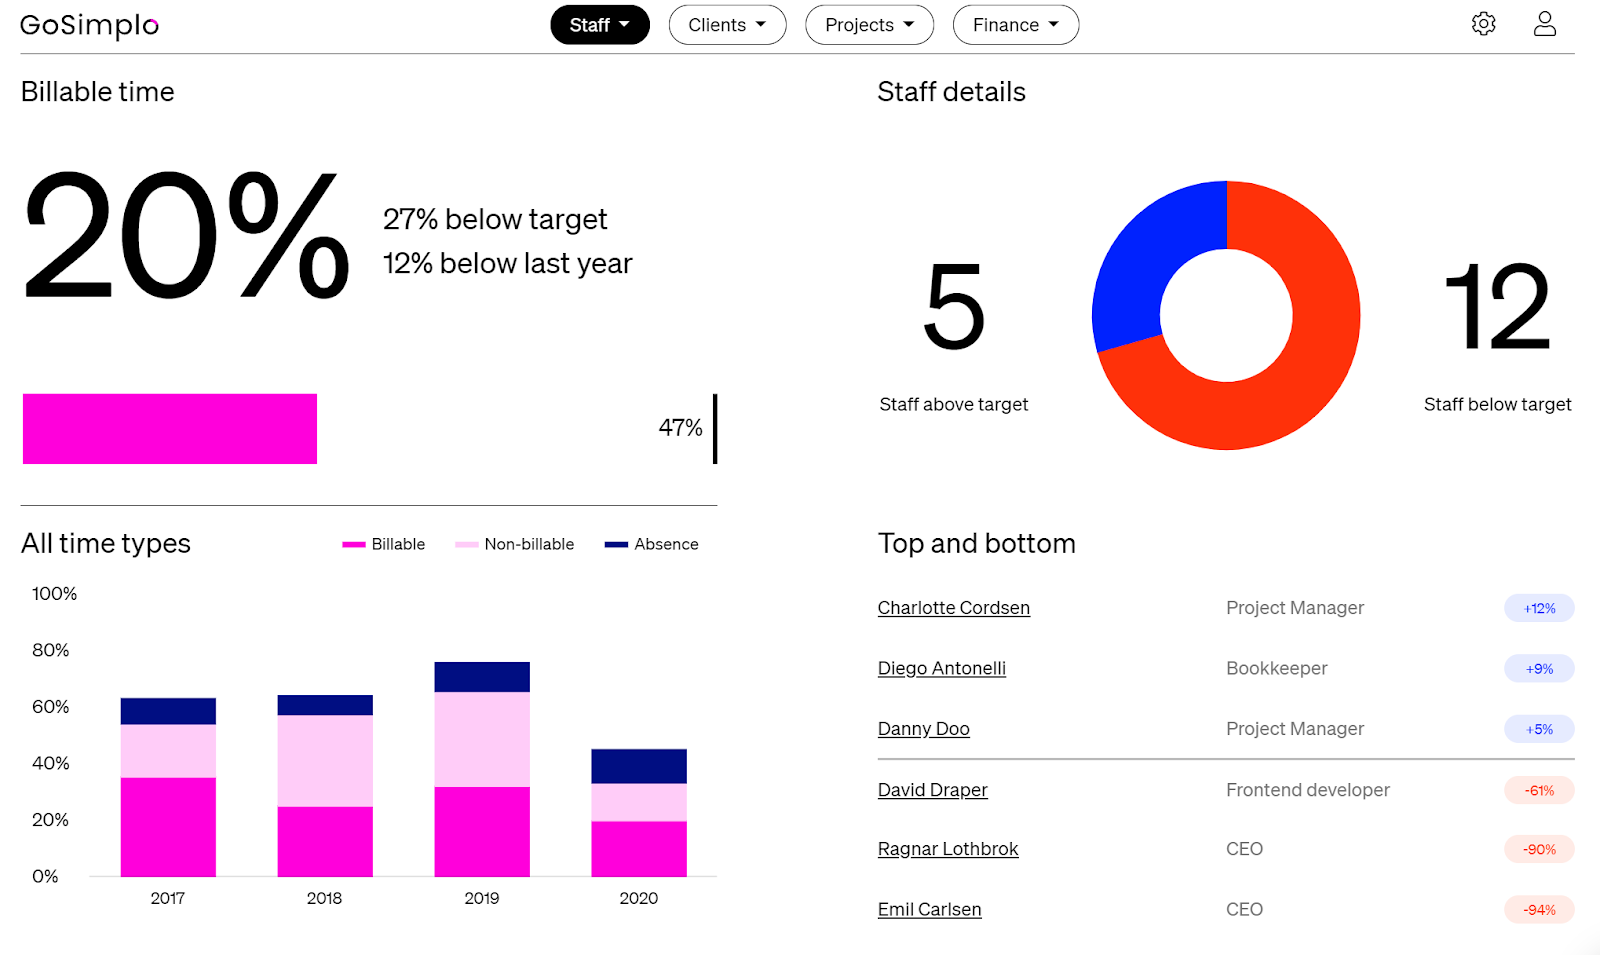
Billable Time % does what it says on the tin: it indicates what percentage of your employee’s time can be billed directly to a client.
This allows you to discover if your team is spending enough time on client deliverables, or whether too high a proportion of their time is spent on tasks that are not directly providing revenue.
Billable Work Value

Calculating the final revenue result for a client or project can be somewhat cumbersome and delayed in a Professional Services company.
This can be due to different accounting policies, writing off the value of projects, and a plethora of other reasons.
Billable work value in a management report can serve as a good indicator of achieved revenue level instead. When your business is busy with clients, the value rises, which will likely (and hopefully!) translate to revenue at some point – either now or later.
True Bill Rate
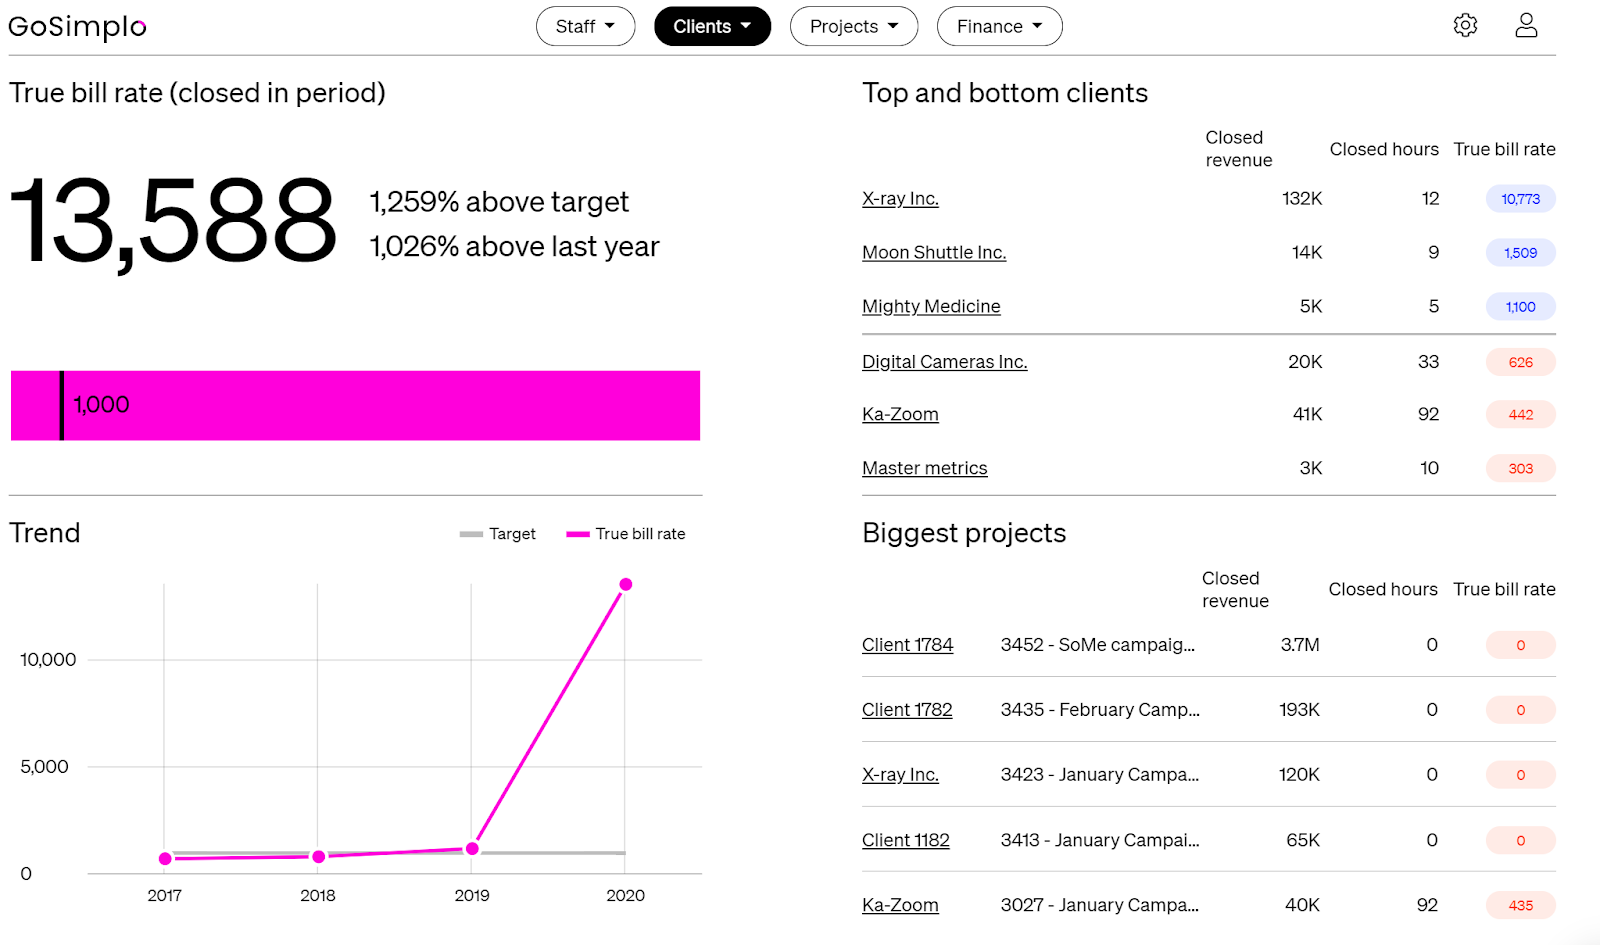
After adding up all the different types of activities a professional services business performs for a client, True Bill Rate expresses the average rate you’re actually paid.
By combining financial and accounting data with project management reporting and time tracking software, you’re able to assign a real monetary value to your employee’s time for each client.
The simplicity of the calculation - that doesn’t rely on estimated figures - makes this an extremely useful metric that is easy and intuitive to grasp.
In other words, it’s a simplified approach to measuring profitability of every client and the company as a whole.
All professional service businesses should regard these metrics as fundamental KPIs when management reporting, as they are a simplified approach that reveal the profitability of every client and the company as a whole.
How to improve your management reports in a Professional Services business
With the wide array of metrics that are available to businesses nowadays, it’s essential to distill your management reporting down to a few key metrics that provide a high level of insight into your activities.
Furthermore, there are some fairly straightforward ways to improve profitability within a professional services company:
- Spend as much time on client deliveries as possible
- Make sure you get paid well for those deliveries
It’s not exactly rocket science, but surprisingly few project management reporting and accounting systems deliver these essential insights in a simple, constantly updated, and understable format.
Which leads us to the best way of collecting and presenting the above KPIs in your management report…
A free data visualization tool like GoSimplo.

GoSimplo presents all of the KPIs mentioned above in an accessible format that’s easy to understand.
Because the platform connects with your financial and accounting software, it also allows you to access your Profit/Loss trends, cash, future payments, and client receivables.
Essentially, you have all the information you need to create your management report, in one place, for free.
Complete oversight of your basic operations is the first step to empowering yourself on a strategic level.
It allows you to identify your strengths and weaknesses, and then act upon them - which is the purpose of management reporting in the first place.
Conclusion
As with most things, a good structure and well-thought out plan will aid you in creating an insightful and innovative management report.
The process can be daunting if you’ve never done it before: the sheer amount of information at your fingertips can in some ways be a hindrance rather than a help.
Using the latest data visualization tools and dashboards can massively streamline the process of management reporting - and there are free tools out there that present an ‘all reward, no risk’ scenario.
Reducing the time it takes you to gather conclusions has an added benefit: the less time you spend creating the report, the more time you have to implement its conclusions in a reasoned and well-considered manner.
Knee-jerk reactions are rarely good decisions in business!
Sign up to GoSimplo for free - forever - today.


.png)


.jpg)
